Health Affairs
As the federal government strives to enroll nearly 5 million children who are eligible for – but don’t have – government-funded insurance programs, this study suggests a strategy that is similar to running for president: Focus primarily on several key states.
Those would be California, Florida and Texas, home to 38 percent of the children who are eligible for but not enrolled in Medicaid or the Children’s Health Insurance Program (CHIP). “Increasing participation in those three states will be critical to reaching the national goal,” says the report published Friday in Health Affairs.
The study was released at a Washington news conference in which Health and Human Services (HHS) Secretary Kathleen Sebelius and Education Secretary Arne Duncan sought to draw more attention to HHS’ Connecting Kids to Coverage Challenge. HHS said that since the campaign’s February launch, 17 organizations have signed on to help enroll more children, including First Focus, Voices for America’s Children, Families USA and the Robert Wood Johnson Foundation. The full list is here.
The study, led by an Urban Institute researcher, examines the nation’s uninsured children by such characteristics as age, race and geography. It states that 7.3 million children were uninsured on an average day in 2008, and 4.7 million of them were eligible for Medicaid or CHIP.
Sixty-one percent of those uninsured-but-eligible children live in 10 states, according to the study, with California, Florida and Texas accounting for 1.8 million of them. Those three states have disproportionately high numbers of eligible children to begin with, the study states, but Florida and Texas have participation rates well below the national average of 81.8 percent.
While participation rates in some states are above 90 percent (with Massachusetts the highest, at 95.2 percent), rates in other states (such as Nevada and Utah) ranged into the mid-60s. This national map shows how each state compares with the national rate.
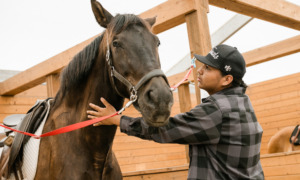
Western states account for a disproportionate number of those with low rates, which the study partially attributes to “the relatively larger shares of Native American children in those states.” American Indian/Alaska Native children had the lowest participation rates (68.0 percent). African-Americans had the highest (87 percent).
The study suggests “targeted enrollment, retention, and outreach efforts” aimed at “particular subgroups” of children.
Earlier coverage: HHS recently launched another campaign, Get in the Game, in which youth sports programs will work to get their participants into Medicaid or CHIP. The campaign is explained here.
A recent study looked at a promising effort in Maryland that uses income tax forms to help enroll more youths.