 The United States prides itself on being the land of opportunity, and we like to believe that everyone has the chance to succeed in life. A key component in this belief is the provision of free public education, which is intended to reduce the differences among children of varied circumstances, giving each a chance to achieve according to his or her abilities and talents.
However, according to Bruce Baker, professor in the Graduate School of Education at Rutgers University and co-author of a new report from the Educational Testing Service (ETS), “Child Poverty and Education: Finding the Way Forward,” that belief may not hold up to scrutiny.
According to Baker:
“While education has been envisioned as the great equalizer, this promise has been more myth than reality. Not only is the achievement gap between the poor and non-poor twice as large as the achievement gap between Black and White students, but tracked differences in the cognitive performances of students in every age group show substantial differences by income or poverty status.”
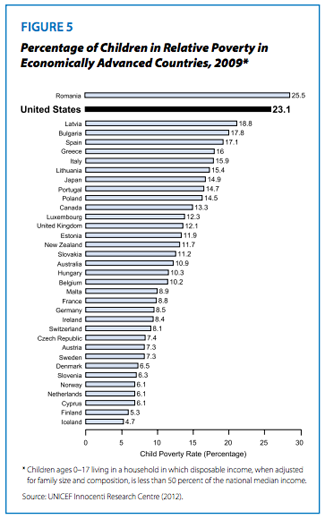 Today, more than one in five American children (22 percent) live in poverty, the second highest rate (after Romania) among the 35 richest countries in the world. Child poverty rates are even higher for some subgroups, including African-American children (28 percent), Hispanic children (25 percent), and children from households headed by a single female (31 percent).
On average, poor children have worse educational outcomes from the preschool years through college, and the negative effects of childhood poverty often persist throughout their lives. In adulthood, those who were poor as children tend to have lower incomes, poorer health and a higher probability of becoming involved with the legal system than children raised in higher-income households. The total cost to the nation of child poverty is estimated at around $500 billion annually.
A comparison of children from homes below and above the poverty line found that even among 2-year-olds, children from poor households do worse on average in language skills such as listening comprehension, letter recognition and expressive vocabulary. Poor children tend to score lower on standardized achievement tests such as the National Assessment of Educational Progress (NAEP), and to have lower scores on the critical reading section of the Scholastic Aptitude Test (SAT). These inequalities persist through the college years: looking at children born between 1979 and 1982, more than half (54 percent) of those from families in the highest income quartile graduated from college, versus only 9 percent from the lowest income quartile.
Comparing children who, before age 5, lived in homes with an income below the
 poverty level, up to twice the poverty level or more than twice the poverty level, the poorest group completed 11.8 years of education on average (less than high school graduation), the middle group 12.7 years and the richest group 14 years (equivalent to two years of college).
Children from the highest-income homes also earned more—an average of $39,700 annually, over twice as much as children from the poorest homes ($17,900), and almost 50 percent more than children from the middle group ($26,800). Women from high-income homes were less likely to have a nonmarital birth (9 percent, versus 50 percent for the lowest-income group and 28 percent for the middle group), while men were less likely to have been arrested (13 percent, versus 26 percent for the lowest income group and 21 percent for the middle group).
The ETS report concludes with seven recommendations to help improve outcomes for poor children: increase awareness of poverty and its consequences, fund schools adequately and equitably, increase access to high-quality preschool programs, reduce segregation, adopt school practices shown to be effective, recognize the importance of good teachers, and improve methods for measuring poverty.
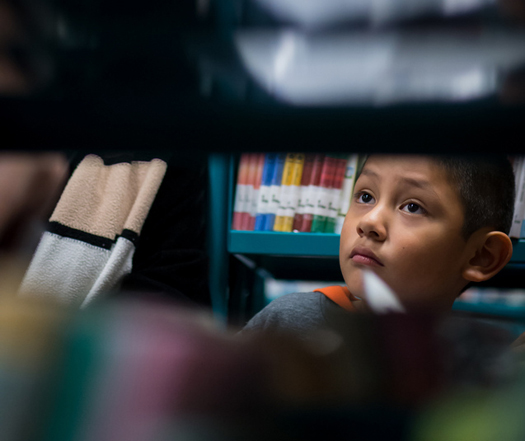
Photo credit: Howard County Library System / Flickr (license: http://creativecommons.org/licenses/by-nc-nd/2.0/).
Graphs via report “Child Poverty and Education: Finding the Way Forward.”