 |
|
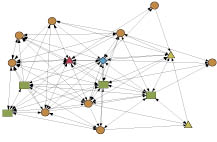
Healthy lines: This graphic of the network in Santa Cruz in 2006 shows many agencies, with arrows indicating helpful interactions among them. |
How do you translate a complex statistical and mathematical evaluation strategy into something people can understand?
Draw a picture.
That’s how co-evaluators Jeffrey Butts of the Chapin Hall Center for Children at the University of Chicago and Jennifer Yahner of the Urban Institute were able to illustrate overall improvement in the patterns of interaction among organizations and agencies in communities hosting the Robert Wood Johnson (RWJ) Foundation’s Reclaiming Futures initiative.
Reclaiming Futures works to develop community-based solutions to juvenile substance use and delinquency by combining system reforms, treatment improvement and community engagement.
Using an evaluation model called social network analysis, Butts and Yahner turned reams of survey data into “sociograms” – maps of the health, strength and helpfulness of the collaboration and communication among the organizations.
In the report “Agency Relations: Social Network Dynamics and the RWJ Reclaiming Futures Initiative,” the evaluators find that despite each pilot site’s unique set of resources, players, obstacles and systems, those whose sociograms illustrated a high level of helpful interactions across agencies had an enhanced ability to address the needs of substance-abusing youth.
A New Approach
RWJ knew this initiative would be a big-picture proposition involving multiple systems.
“The philosophy that drove the development of the Reclaiming Futures model was: How can we boost the connectivity and effectiveness of the community fabric” that supports those youth, said Laura Nissan, the initiative’s project director. “If we’re going to reclaim youth, no one system can do that.”
In 2002, the initiative awarded a total of $21 million in five-year grants to 10 pilot sites to help them reinvent the way law enforcement, courts, detention facilities, treatment providers and community partners help at-risk youth. (See story, page 36.)
Measuring the effectiveness of a collaboration to improve “the community fabric” clearly called for something beyond a standard evaluation. Butts and Yahner hit upon the idea of using social network analysis: a tool used to examine a network’s structure and membership, the roles played by network members and the patterns of interaction among members over time.
Such analysis is applicable to groups of any size and kind; it’s been used to study the characters in “Hamlet,” and it could be used to examine systems of care made up of hundreds of people and agencies that cross public, private and nonprofit lines.
Data In …
The evaluators administered surveys six times from December 2003 to June 2006 to key individuals at eight of the pilot sites: Anchorage, Alaska; Santa Cruz, Calif.; Marquette, Mich.; Dayton, Ohio; Portland, Ore.; Seattle; southeastern Kentucky, and several areas in New Hampshire.
For the first survey, Butts said, evaluators asked Reclaiming Futures’ project directors for the names of 30 to 50 people in their communities “who were in the best position to be experts about how juvenile justice works, about how adolescent drug treatment works here.”
Those individuals – typically judges, probation officers, substance abuse and mental health treatment professionals, community activists, faith-based organizations and youth advocates – were then sent electronic surveys in which they were asked to submit the names of individuals they perceived as local experts and colleagues.
Each subsequent round of surveys asked respondents to list the names of contacts who weren’t already on the list. Those individuals were invited to participate in the next round of surveys.
Butts explained, “We asked respondents … ‘In an average week, who do you talk to, who do you e-mail with, who do you see at meetings? And by them reporting who they talked to and met with, the structure of the networks emerged.”
Over the course of the six survey rounds, a total of 456 unique respondents completed at least one survey. Everyone identified in each of the six survey rounds was asked to answer questions about survey participants with whom they routinely interact. They were then asked to respond to statements about those individuals, such as, “I talk to this person (A) frequently, (B) somewhat frequently, (C) never,” and to rate such interactions as helpful or not helpful.
The results of three of the surveys – those for 2004, 2005 and 2006 – were analyzed for this evaluation. The answers about individuals were aggregated into organizational groups for reporting purposes: project grantees, courts, justice programs, treatment providers and community partners.
… Diagram Out
The data were translated into sociograms: computer-generated diagrams that look like spider webs of interconnected points, or “nodes.”
Each node represents an organization or organizational group, such as community partners. The shape and color of the node indicates the type of organization. The nodes are connected by arrows representing helpful interactions between two organizations. Arrows always point from receivers to givers of help.
The sociograms illustrate the nature of the network and the helpful interactions between its members. For example, the size of the network is revealed by the number of nodes in the sociogram.
Agencies that appear as powerful (cited repeatedly by others as being helpful) have many arrows pointing toward them. Those shown as instrumental (reporting their interactions as integral to the work of other agencies) have many arrows emanating from them.
The sociograms also reflect agencies’ “proximity” to one another, i.e., their propensity to connect directly, rather than through third parties. Agencies appear closest to the organizations with which they interact the most. Those in the center are connected to the largest number of other network organizations. Organizations at the edges have fewer connections.
Statistical charts accompanying the sociograms report on the density (percentage of all possible helpful interactions) and cohesion (percentage of all possible reciprocal interactions) of each network. In networks that score low on “power equity,” few agencies are seen as powerful; only one or two have arrows pointing toward them. A high score on power equity indicates that credit for being helpful is more equally distributed among agencies.
In networks that score low on “instrumental equity,” few agencies report their own interactions as integral to the work of others, while a high score indicates that all agencies report helpful interactions somewhat equally.
For the study, measures of density, cohesion and equity for each network were compared with the average for networks of the same size.
Findings
What the researchers got out of this was something that a report of words and data alone cannot provide: a literal picture of the health of the networks. Each site’s sociogram strikingly portrays changes in network dynamics from the first to third years.
For example: In several networks, particularly in New Hampshire and Santa Cruz, the number of agencies increased – a healthy sign, in RWJ’s view.
Another sign of health was increased density (reflecting helpful interactions) and cohesion (reflecting reciprocal interactions) among agencies. This was seen in the increased busyness and complexity in 2006 sociograms – which had more nodes and more arrows – compared with sociograms from 2004. Here the visibly above-average performers were Anchorage, Seattle, Santa Cruz and Dayton.
Rural areas typically had a tough time scoring high on number of agencies and density. For both years, Kentucky’s sociogram is sparse and spread out, with few nodes, more homogeneous types of nodes, few arrows, and only one or two powerful or instrumental agencies.
Nearly every network showed a lot of treatment programs and community partners, but in some of the sociograms, many of those partners were literally on the periphery. These peripheral agencies often were not directly involved in justice work, and one priority of Reclaiming Futures is to strengthen the role of such agencies in the networks.
Overall, the sociograms and the data suggest that at most of the sites, Reclaiming Futures is helping to knit together stronger and more equitably responsive systems of care.
The report is available at www.reclaimingfutures.org/sites/default/wp-content/uploads/sites/13/documents/agency_relations_2007.pdf.