Geographic Information Systems (GIS) are all the rage right now, and many youth-serving organizations have embraced the technology to improve their understanding of where at-risk youth are, to help youth and their families find needed services and to connect youth workers with one another.
“Maps can help you find out why things are the way they are and what you can do to change them,” says Wendy Brawer, founder and director of the Green Map System and creator of the Green Apple Map of New York City in 1992. “Maps provide a way to present a vision to decision-makers.”
In essence it’s a simple two-part process: Collect data and build a map based on the data, for example, of all the after-school programs and the ages they serve or all the emergency food resources in an area and their opening hours. While such maps might once have hung on the wall of an agency administrator, computers can put these same maps at the fingertips of anyone who might find them useful: from that same administrator to hungry families and the social workers and politicians who are trying to help them.
With a bit more sophistication and technical finesse come interactive maps: Type in an address, and programs in the area are displayed automatically. The more complex mapping systems require full- or part-time technical personnel to maintain and update them; simpler maps can be updated by youth-serving agencies themselves.
Though the lack of access to online services may make it difficult for the people who need the maps to access them directly, online and interactive community maps have proved an invaluable resource for social and youth workers.
Reasons to Map: In Utah, the Board of Juvenile Justice has used an online Risk and Protective Factors Information Tool to help determine which localities have the greatest funding needs, something that is essential for a board that operates on a tight budget and for small localities seeking their appropriate shares of state money.
“Through the online tool, we found that kids in rural areas have more risk factors and less protections than kids in urban areas,” says Matthew Davis, a research analyst with the Utah Criminal Justice Center, who helped create the online tool. “This led the Board to change its funding practices.”
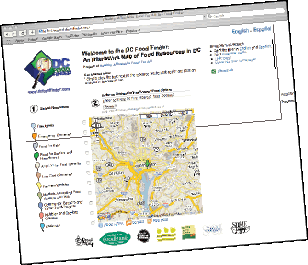
Alexandra Ashbrook, director of D.C. Hunger Solutions, says the coalition of organizations that started the D.C. Food Finder website had tons of data on the city’s food services but weren’t sharing with one another. Every coalition member contributing to the online map had a set number of categories of information to collect and submit to the Food Finder.
In many cases, young people can help with data gathering. “Community mapping can engage young people in data collection and focusing on specific issues,” says Raul Ratcliffe, senior program officer with the Academy for Educational Development (AED).
Jonnell Allen, community geographer at Syracuse University, who helped Onondaga County, N.Y., create an online map of youth services, says it is important to consider how to collect data. “The survey’s design is critical,” she says. “It can be hard to get the right questions, so it’s important to pilot a survey.”
Getting It Done: Dan Bassill, president of the Tutor/Mentor Connection (TMC) in Chicago, believes partnerships are critical. “Geographic Information Systems are a specialized skill,” he says. “Not everyone can do this.” Find a partner willing to provide GIS services, as funding is hard to come by, he suggested.
“It helps for funders to know there is evidence this is a strategy that works,” says AED’s Ratcliffe. “Be prepared to show outcomes from similar projects in other communities.”
It’s also essential for potential partners to understand a community map will serve everyone and is not designed to forward one organization’s agenda. “We need to get away from competing with one another,” Bassill says. “Instead, we should connect with other people trying to do the same things.” Maps can help.
Resources:
• http://HungerMaps.org, a mapping system created by the New York City Coalition Against Hunger to map community anti-hunger resources.
• Community Youth Mapping, http://www.communityyouthmapping.org, provides a CD curriculum and guide, took kit, and training for developing community maps, with a typical contract costing $15,000 to $20,000.
• U.S. Department of Justice http://FindYouthInfo.gov has a community mapping tool.
• Green Map System, http://www.greenmap.org, has a mapmaking system and iconography available to communities for use around the globe and has more than 530 projects in 54 countries.
• The Forum For Youth Investment has a sample landscape mapping survey available through its “Ready by 21” Webinar series—check out the downloadable PowerPoint presentation on landscape mapping at http://www.forumfyi.org.
D.C. Food Finder
Healthy Affordable Food for All
Washington, D.C.
(202) 986-2200
http://www.dcfoodfinder.org
The Strategy: Use an online publicly accessible interactive map to show youth and families where they can find food resources, including emergency groceries, free meals, urban food projects, farmers’ markets, nutrition and cooking classes, and food benefit services.
Getting Started: D.C. Food Finder is a project of Healthy Affordable Food for All (HAFA), a coalition of Washington, D.C., organizations providing food services and information to low-income families. The coalition emerged out of a mapping project begun by D.C. Hunger Solutions in 2006 to assess the city’s food service offerings in the hope of obtaining expanded services through Federal Nutrition Programs administered by the U.S. Agriculture Department’s Food and Nutrition Service.
How it Works: Users of http://DCFoodFinder.org type in an address, and the online map shows food resources in that neighborhood. All the coalition partners contributed data to the online mapping system, created by partner Social Compact, an organization with expertise in analyzing economic data in underserved communities. All partners have the ability to update the mapping system when information changes.
Youth Served: D.C. Food Finder does not specifically target young people, but youth are one of its major beneficiaries. Youth from immigrant families are typically the ones gathering information for family members who may have little or no command of English (though the Food Finder is also available in Spanish) or technical literacy.
Staff: D.C. Food Finder has no dedicated staff. It is maintained by Social Compact and updated as needed by staff members from the coalition partners, which include Bread for the City, Capital Area Food Bank, D.C. Central Kitchen, D.C. Hunger Solutions, The 7th Street Garden, Social Compact Inc., SOME (So Others Might Eat), and Summit Health Institute for Research and Education Inc.
Money: It cost about $4,000 to get up and running, though Social Compact provided many services without charge. Funding came from the budgets of each of the coalition partners.
Results: Since the site launched in July 2008, it has received 6,613 unique visits, averaging 45 visits a day, primarily from social service workers. The D.C. Food Finder’s impacts are mainly anecdotal; Alexandra Ashbrook, its director, says city council members have been advised of the service because the majority of calls they receive from constituents are about where to get food.
Utah Board of Juvenile Justice
Salt Lake City
(801) 538-1372
http://www.juvenile.utah.gov and http://trivergia.com/risk/Utah
The Strategy: Provide a statewide publicly accessible online tool for youth workers, government officials, granting agencies and young people to collect data on at-risk youth and get access to services.
Getting Started: The online Risk and Protective Factors Information Tool grew out of efforts begun in 2000 by the Utah Board of Juvenile Justice to see where youth programs were needed. Matthew Davis, a research analyst with the Utah Criminal Justice Center at the University of Utah, which helped create the online tool, says the Board of Juvenile Justice was looking for a way to empirically justify funding for youth programming in various areas of the state.
How It Works: The risk and protective tool has a map dividing Utah into counties and cities. Users click on the locality for which they want data. The program then provides information on the number of at-risk youth in that area in grades 6, 8, 10 and 12. (Data are based on the Student Health and Risk Prevention (SHARP) survey.) The tool also shows what risks provide the greatest threats to youth in a specific area, be it drug use, gang involvement, depression or academic failure. By the end of the year, the online tool will also provide data on youth programs statewide, as well as census data, public school test scores and school attendance figures.
Youth Served: The risk and protective tool does not specifically serve youth but is used mainly by state funding agencies, as well as social and youth workers.
Staff: Davis and a statistician work on development and maintenance of the online tool, and one research assistant works on the project part-time. In terms of hours, Davis says the staff time required to run the tool is equivalent to about 1.5 people.
Money: The budget to create the online tool was just over $50,000. Funding came from the Utah State Office of Education, which received its funds from a three-year Title II Formula grant from the federal Office of Juvenile Justice and Delinquency Prevention (OJJDP).
Results: Davis says he has collected data on 490 youth programs in Utah so far, all of which will be online by the end of this year. When Utah agencies and organizations apply for grant money through the state, they are now required to use the risk and protective tool to justify the need for certain youth programming in specific areas of the state.
Tutor/Mentor Connection
Cabrini Connections
Chicago
(312) 492-9614
http://www.tutormentorprogramlocator.net
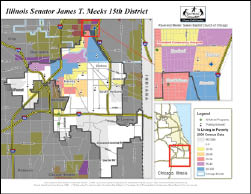
The Strategy: Connect Chicago youth service providers, families and kids with youth resources and programs, as well as local economic and social data, through a comprehensive, one-stop online database and mapping system.
Getting Started: Cabrini Connections started in 1965 as a volunteer program for employees of Montgomery Ward headquarters in northern Chicago. After the headquarters closed, the volunteer program continued, with the formal establishment in 1992 of Cabrini Connections and the Tutor/Mentor Connection (TMC) as nonprofits.
One of the major priorities of TMC was to establish a database of after-school programs for youth. To do this, TMC employed GIS technology to create a map gallery that connects users with everything from tutoring and mentoring programs around Chicago to Chicago places of worship.
HowIt Works: Users follow the website link to TMC’s “Map Gallery,” where they will find a variety of maps relevant to data on Chicago youth and the availability and location of youth services. One example is the Tutor/Mentor map gallery, where users can find services on maps based on age groups served, time of day programs are offered, and school districts. When users click on a specific area of the map, the system brings up a list of relevant youth programs in that ZIP code.
Youth Served: Bassill says it’s difficult to calculate how many youth benefit from the Tutor/Mentor Connection and its online maps, but he notes that 250 organizations are listed in the connection’s database. TMC websites receive 11,000 to 14,000 site visits each month.
Staff: One part-time staff person and two or three volunteers maintain TMC’s maps, while a paid outside consultant creates the interactive maps.
Money: An anonymous donor provided $50,000 to rebuild TMC’s mapping system and make it interactive for users. Half funded a part-time mapper for the Mapping for Justice blogspot, and the other half pays for a consultant to build the interactive maps. Bassill estimates the yearly cost at $25,000 to $50,000. HSBC Bank provides funding to TMC for a technology staffer, and some of that money goes to online mapping projects.
Results: While TMC does not specifically track usage of its online interactive maps, the organization’s website as a whole has facilitated over 1,200 events through users employing its databases to obtain resources, find access to services, organize community action, and provide information to the media. TMC tracks these events through an Internet-based Organizational History and Accomplishments Tracking System.
Youth Resource Mapping Project
Syracuse Community Geography
Syracuse University, N.Y.
(315) 443-4890
http://www.maxwell.syr.edu/geo/community_geography/index.html and http://www.mapsonline.net/syracuse/
The Strategy: Provide a comprehensive geographical assessment of youth resources available to young people in Syracuse and Onondaga County with data ranging from after-school programs to food pantries.
Getting Started: The Youth Resource Mapping Project began in 2005, when the Syracuse University geography department collaborated with the local nonprofit Reach CNY (Central New York) to see whether youth programs and services were geographically accessible to all. The university’s community geographer, Jonnell Allen, and a summer intern gathered information for the map by distributing one-page surveys to 300 community organizations, social services and government agencies, and public libraries in Syracuse and Onondaga County. The surveys requested information on youth services and programs offered, eligibility requirements, food availability and access to public transportation.
How It Works: Users of the resource map can select particular services they are seeking in Syracuse or Onandoga County, such as youth programs, food pantries, libraries or bus routes, and then select a particular area to search (such as downtown). The program takes the selected data and produces a map for the user showing where his or her selected services are located in the chosen neighborhood.
Youth Served: Allen says she has no information on who is accessing the Youth Resource Map but indicates her primary target audiences are community-based organizations and public librarians, who can help youth access the tool.
Staff: One full-time community geographer and a summer intern. Allen works on GIS programs requested by community organizations throughout Syracuse and Onondaga County.
Money: When the mapping project was conducted and completed in 2006, the cost was about $25,000 a year. That figure represents half of Allen’s salary at the time, plus the salary of a summer intern. Allen’s position is funded by Syracuse University and local charitable organizations, including the Gifford Foundation, Central New York Community Foundation, Allen Foundation and Horowitz Foundation.
Results: Since the map went online, Allen has trained 150 community organizations in its use. She says 20 youth-serving agencies have used data from the map this year for funding requests.


