 Back in 1992, Richard Murphy guided 2,100 youth in plotting some 7,000 resources in their New York City neighborhoods – everything from restaurants to youth programs – in an effort to help connect them with the adults around them. Today, he thinks the products produced by such work can help serve as the backbone of a national youth information line that he’s working to create.
“As much as we have an information glut in the world now, young people don’t have, sometimes, a real visceral feel for what exists for them, and that things for them exist beyond the school and the mall,” Murphy says.
The strategy, most commonly labeled youth mapping, has drawn a modest amount of support among policymakers and practitioners. Today the approach generally entails paying youths small fees to collect information about their communities, then coordinating that data using geographic information system (GIS) technology.
Mapping proponents tout its ability to boost kids’ community awareness without beating them over the head with it.
 “There is no other strategy that moves kids from engaging in the community to policy formulation and civic engagement quicker than mapping,” says Harry Wilson, who heads the Family and Youth Services Bureau as associate commissioner for the U.S. Administration on Children, Youth and Families (ACF).
The first mapping project came on the heels of the infamous Rodney King verdict in 1992, when Murphy, then New York City’s commissioner of youth services, sought to engage youth in order to prevent the kind of violence that erupted in Los Angeles. (See “Youth Map Greater Roles for Themselves,” March 1998).
The strategy was a descendant of community mapping efforts done by the Robert Wood Johnson Foundation (RWJF), which analyzed such things as the connection between the concentration of liquor stores and violence.
RWJF, however, used professional mappers to influence community policy. Youth mapping is as much about the process of getting information as it is about the final product.
“It’s all of the life skills and work force skills they develop while taking part in the project, but in a safe setting with caring adults,” says Pinellas County 4-H Agent Beth Tobias, whose 4-H is as committed to youth mapping as any program in the country.
“Just the actual process of learning to address people and how to formulate questions” is valuable, Wilson says. And because the youths often present their final product to an official body – such as a school board or city council – “you have kids engaged in policy directives.”
Tech Boost
The most significant advance in youth mapping programming came in 2001, when the nonprofit Academy for Educational Development (AED) filled a much-needed technology gap. Murphy joined AED as director of its Center for Youth Development and Policy Research in 1995, and the Edna McConnell Clark Foundation later funded AED to serve as the national provider of mapping technology to nonprofits.
AED helps organizations set up their projects and train youth mappers. More importantly, it has provided Web tools to aggregate and update the data, which would be a daunting task for nonprofits that lack the appropriate technology and staff.
“We’re the only game in town” for most nonprofits seeking help, says Eric Kilbride, the co-director of AED’s Center for Youth Development and Policy Research.
A project can cost from $15,000 to $150,000, according to Kilbride. He says AED’s fees, which have been subsidized by the Clark foundation, range from $7,500 for training and technical assistance only (some programs use their own GIS programs) to $50,000 for a Web license fee on higher-end jobs such as statewide projects, for which AED performs data entry, updates and dissemination.
AED’s national source for mapping assistance has helped proliferate and refine the approach to the point that Murphy hopes to incorporate data from mapping projects into the nonprofit he recently created, called Youthline America. (He is no longer at AED.) The program would use regional Web and phone services to provide youth with everything from substance abuse referrals to lists of recreational activities in a particular area.
Roadmap to Funding
Mapping has its fans in the funding world. The William K. Kellogg Foundation, based in Battle Creek, Mich., has supported mapping projects, and Clark funded AED’s mapping efforts for five years. (The grant expired in 2005.)
On the federal funding side, specific youth mapping allotments are available through Workforce Investment Act funds and the Department of Labor’s Office of Disability Employment Policy, although that funding was cut sharply in last year’s appropriations. Wilson says some new ACF grants for community empowerment could be used for mapping projects.
But for mapping to take the next step as a worthy investment for potential federal and private money, Wilson says, its champions must produce an evaluation to demonstrate effectiveness.
“If evaluation shows it has promise, it’s going to move it forward,” Wilson says.
Child Trends, the Washington-based research group, says it is crafting a proposal to evaluate mapping projects. Like much of youth work, however, it won’t be easy to quantify the benefits of mapping. “I’m not sure what you’d look at exactly in an evaluation,” Tobias says. “But we can just see the impact it has on our kids.”
That won’t be good enough to draw continued funding, says Kristin Anderson Moore, Child Trends’ emerging issues director, who is overseeing the evaluation pitch with Indicators Director Brett Brown.
“So often, a person or program has a good idea, it catches on, gets widely implemented, training starts to develop,” Moore says. “And then, the funders all start wanting evidence.”
One crucial question: How much should an evaluation weigh long-term outcomes – such as college graduation and no involvement in the justice system – against such short-term benefits as job training and building self-esteem?
Following are several examples of how youth agencies have created, funded and carried out youth mapping.
Hampton Coalition for Youth
Hampton, Va.
(757) 728-3280
www.hampton.va.us/foryouth/index.html
History and Organization: The City of Hampton formed the Hampton Coalition for Youth in 1990 to foster leadership development and work force training. It oversees the city’s youth commission, a group of 24 teens that serves as an advisory board to the Hampton City Council. (See “U.S. Anti-Drug Funds Misfire, Hit Target,” June 1999.)
The Project: The youth commission and other members of the coalition debated the concept of a “youth-friendly space,” ultimately determining 10 criteria that include affordability, amiable staff and cleanliness. “The constant lament is, ‘There isn’t anything to do,’ ” says coalition Director Cindy Carlson. “They surmised that there are things to do, but maybe kids don’t know where they are or those places aren’t youth-friendly.”
The commission hired young people to assess the friendliness of local businesses and youth-serving organizations. For the businesses, the youth served as secret shoppers, patronizing local restaurants and stores while noting certain aspects of the service. At youth programs, the youths showed up unannounced to ask for help, while other youths on the project conducted formal interviews with management to find out about the services.
Results: The project resulted in a list of businesses and organizations deemed “youth-friendly” or “not youth-friendly.” The commission lists the friendly businesses on its website (www.hampton.gov/youth) and compiled a 12-page guide to becoming youth-friendly, which it sent with a letter of notification to each business and organization that it rated “not youth-friendly.”
Youth Involved: About 100 youth were in on the discussions to define the scope of the project. The 24 youths who sit on the youth commission oversaw the project, while the commission hired 15 young people to do the mapping.
Staff: Carlson is the adult that oversees the commission’s mapping projects, assisted by the city’s appointed youth planners (the two teens who lead the youth commission). Most of the project was done last year with oversight by Senior Planner Sarah Rodriguez, who handed it off to fellow planner Ivey Hawkins. Hawkins is helping to fulfill a request for proposals from other area youth programs that are interested in taking on the task of updating the data annually.
Funding: Carlson estimates that the effort cost $3,000, mostly to pay the mappers ($6.60 per hour) and provide them with petty cash for scouting out businesses. It cost an additional $1,200 to put together the publication with the project’s findings. A number of the youth commission members are trained to use GIS technology, so the data from the project was documented internally.
Pinellas County 4-H
Largo, Fla.
(727) 582-2100
http://coop.co.pinellas.fl.us/4hyouth/4h.htm
History and Organization: Pinellas County 4-H, part of the 4-H Extension operated by the University of Florida, is an agency of the county government. It has conducted mapping projects with AED since 1999, when its first mapping group charted the availability of all youth resources in the county.
The Project: Pinellas County was one of four regions in the country given funds to assess the manner in which food and beverages are marketed to young people. The effort was developed by the Washington-based Institute of Medicine, part of the National Academies, which provided funds for AED to distribute to four programs of its choice. The other regions studied were Bowling Green, Ky., the Harlem section of New York City, and Sussex County, Delaware. This was the fifth mapping project done by Pinellas County 4-H.
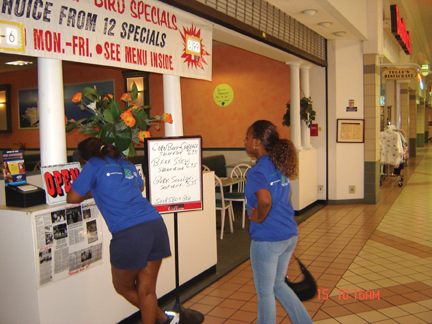
Teens assessed how food and beverages are marketed in places that 5- to 18-year-olds frequent in Pinellas County. The youths identified the places most frequented (such as bowling alleys, the beach, skate parks and the mall), noted what products were featured on the signs at each spot and surveyed business owners or operators. They also conducted 297 in-person surveys with youth and adults around the county.
Results: Findings from the surveys and the observations were not surprising, says 4-H agent Beth Tobias. Youth and adults were influenced most by the taste of food, and second by the healthfulness. Television was identified as the most influential way of marketing food; youths felt that unhealthy food was disproportionately marketed toward them on television, while adults were pitched healthy options. Signs marketing food at local hangouts were predominantly for unhealthy foods, the youths reported.
Youth Involved: Nine teens were selected for the project. Each was paid $6.25 an hour for eight 25-hour work weeks during the summer of 2006.
Staff: Pinellas County 4-H is headed by Janet Golden. Tobias heads the agency’s programs for older youth, which oversees the mapping projects. She led the youths directly on this project.
Funding: Pinellas County 4-H received $14,200 from AED to do the work. Most of it was paid directly to youth via stipends.
Coleman Advocates for Children and Youth
San Francisco, Calif.
(415) 239-0161
www.colemanadvocates.org
History of Organization: Coleman is a 31-year-old child advocacy center for youth and families in San Francisco. It also operates a leadership development program for youth called Youth Making a Change (YMAC).
The Project: The 1994 mapping project was done in partnership with the Mayor’s Youth Employment and Education Program (MYEEP). Richard Murphy, an independent consultant at the time, trained some 250 youth to use a survey developed by AED; they were paid to map the city’s resources for youth and their families in one week.
The mappers returned with information on services such as youth programs, low-price restaurants and, in a grim reminder to staff as to the youths’ circumstances, funeral homes. Data entry was then done by youth offenders participating in Focus Vocational Programs, a service operated by the city’s juvenile probation department.
Results: The project was conducted more than a decade ago, but it still stands as a model and it still has an impact. In 1997, Communities in Harmony Advocating for Learning and Kids (CHALK) had youth contact every resource that was mapped to verify and update the information. A year later, CHALK used the refreshed information to establish Youthline, a phone and online service for youth to find help, entertainment and youth programs. City officials are discussing a larger replication of the initial mapping project, according to Glenn Eagleson, senior planner at the San Francisco Department of Children, Youth and Their Families (DCYF).
Youth Involved: The youth were in MYEEP, led by teens in Coleman’s YMAC program. CHALK had 10 of its youths working on the data verification and employs some 30 youths each year to operate Youthline.
Staff: Former Coleman Executive Director Margaret Brodkin, who now heads DCYF, led the project. Eagleson, who now works for Brodkin at DCYF, ran the project from the city’s side as the director of the Mayor’s Youth Employment and Education Program. CHALK, which is run by Bay Area Community Resources, is headed by Project Director Ruth Barajas.
Funding: Nobody involved could remember the price tag on the project. Funds through MYEEP went for such expenses as paying the youths, who earned minimum wage.
Parent Advocacy Coalition for Educational Rights (PACER)
Minneapolis, Minn.
(952) 838-9000
www.pacer.org
History and Organization: PACER is a 30-year-old nonprofit geared toward improving the quality of life for youth and young adults who have disabilities or are deemed “at-risk.” One of its programs is Connecting Youth to Communities and Careers, known as Project C3, and part of that program is the organization’s resource mapping project.
The Project: The original plan was to identify and map organizations providing services to youth from ages 14 to 22. Youth mappers at three pilot sites were to use an online template to work with each organization and specify its audience and purpose (for example, distinguishing an after-school program for academic enrichment from one that offers work force development).
When the federal funding for C3 and similar projects in other states was eliminated, several state government agencies in Minnesota allocated enough money to expand the mapping project statewide.
C3 has teamed with regional partners, such as community transition interagency committees and youth councils, to take an approach that differs from most mapping efforts. Instead of walking around communities to find resources, the youths amass a target list of youth-serving programs by using databases provided by the local partner agencies. They then ask each organization to fill out the computerized template. That task takes little time, but while many organizations cooperate quickly, it is sometimes difficult to get others to do it, says Shauna McDonald, PACER’s director of community resource development.
PACER is in the second year of the project, and expects to have the entire state mapped by the end of the third year.
Results: PACER has launched a mapping website (www.c3mn.org) and has listed about 550 resources across the state. Regionally, youth have made interesting discoveries about available resources. In the St. Paul area, youth noticed that the resources included very few mental health services for youth with substance abuse problems. McDonald notes that that could mean there aren’t many programs, that existing programs declined to work on the template, or that the local agencies that provided the databases are not aware of existing programs.
Massachusetts and Alaska have adopted Minnesota’s approach. Richard Murphy has expressed interest in incorporating the project’s data and mapping model into his Youthline America concept.
Youth Involved: The regional partners identify local youth whom mapping would most help. In Anoka County, for example, the community transition interagency committee used 16- to 18-year-old girls at Pine School, a correctional facility. The program is operated in each region on one of two models: three-week summer sessions or less intensive year-round sessions. Most summer programs include between 10 and 15 youth, while year-round projects base the number of mappers on the size of the community.
Staff: PACER has 80 employees. McDonald oversees the mapping project with the help of Project Specialist Andrea Moore. At the regional level, two staff members at local government agencies will typically oversee the mapping, McDonald says.
Funding: Minnesota’s Department of Employment and Economic Development (DEED) was one of eight state agencies around the country to receive money from the U.S. Department of Labor’s Office of Disability and Employment Policy (ODEP) to improve outcomes for young adults with disabilities. DEED provided approximately $300,000 to PACER’s Project C3 program to serve as an intermediary for the project, and provided money to three community pilot sites in the state.
When ODEP’s budget was cut in 2006 – thus eliminating the funding for C3 – DEED was one of the state agencies that kicked in to keep the project going and expand it statewide. So PACER is still funded to assist with mapping projects under C3. But where the ODEP money seeded pilot sites to carry out projects, new community mapping projects must be funded with money that the community can tap.


